Monday, November 28, 2011

“Remote SMTP queue length is outside the configured threshold” error in SCOM


Hi,

As the error clearly showing us that the problem is with one and more “SMTP” queue length. Let’s investigate a little bit more about it.

Error:

SMTP

in error the source is “SMTP” and the path is one of our “Exchange Server”, in the error it is showing that the default number of message is set to “200” and the interval is “3600sec (1hour). which means this “SMTP Queue Monitor” check exchange server queues after every hour and if there is more than 200 messages are stuck in the queue it generates an alert.

let’ check our exchange Sever to solve the error

Open Exchange Server “System Manager” navigate to your exchange server and click on queues, and here we found our problematic queue, there is “301” messages stuck in it, the “SMTP monitor is right”,

SMTP-1

Solution:

  1. try to find out why your remote queue got stuck, may be some firewall rules blocking SMTP connection
  2. Make sure your SMTP Connector is working
  3. Right click on your problematic queue click on force connection and see if email start get deliver
  4. Try restarting “SMTP” service
  5. if nothing helps try contacting  any “Exchange Sever” engineer or administrator

in My case solution was different

i select the problematic server and right click on it and choose find messages.

SMTP-2

all the messages which stuck in the queue was “JUNK” then i decide to remove them.

I selected all messages , right click on them and choose “Delete (no NDR)”

SMTP-3

My message queue is not back to zero 0, all is well now , you can close this alert manually or wait for another one hour to get close it automatically.

SMTP-4


Thanks

Aman

Tuesday, November 22, 2011

Yippy !!!! Ten Thousand Page Views


Our Blog have 10,000 Page views ….. {i knew these Number doesn’t matter but stillll…}
Yippy!!!!!!!
10013

“A SQL job failed to complete successfully” error in SCOM

Hi,

As the error is self explainery that one of our SQL Backup Job is failed. How to fix it? Depends how much you know about SQL and you also know what to do. But let’s check which job is failed and let me show you how to check the failed “SQL Job” , I know its quite simple but sometime few SCOM new users don’t know where to find these failed jobs.

Error:

Error is showing that “SQL Job is failed on Computer 2K” and the job name is “Copy Tables From”

Sql_Job_1 

let me RDP to my SQL Server “2K” and let me open “ SQL Server Enterprise Manager”

Click on your SQL Server, expand the “Management” , beneath it expand “SQL Server Agent” and then click on “Jobs” and here is our failed SQL Job. You can see there is a red cross in the front of the the job.

Sql_Job_2

To check the more details about the job, right click on it and then choose “View Job History”

Sql_Job_3

now click on “Show Step Details” if you want to know more info about the job.

Sql_Job_4

So here is the complete step info about the backup job. I think you can find a useful info on why this job failed.

Sql_Job_5

Otherwise: go to your SQL Administrator and told him “Damn, Fix it ,”

Thanks

Aman Dhally

Monday, November 21, 2011

SCOM : How to resolve “The SMTP Local Retry Queue Total is outside calculated baseline” error in SCOM.

Hi
As the notification is clearly saying that there is some error in our exchange server’s Local retry Queue. But what is the exactly happening.?
Let explore it little bit.
Error :::
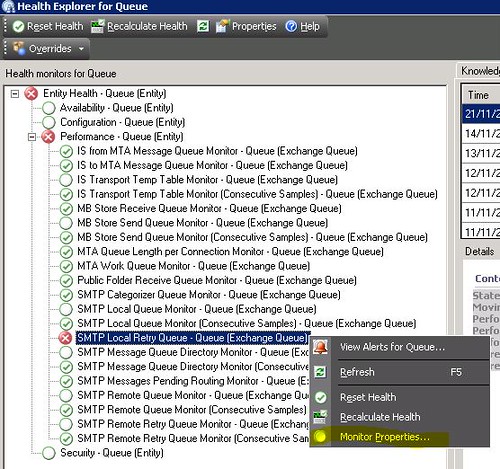
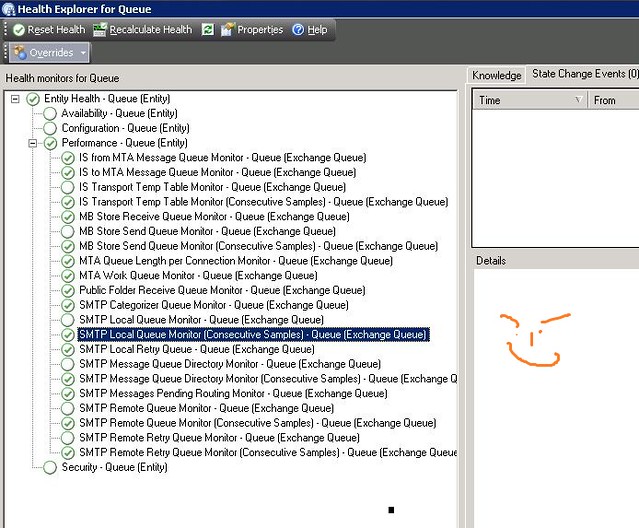
Right Clink on the Error, Click on Open and Choose “Health Explorer”

Now Click on “SMTP Local Retry Queue - Queue [Exchange Queue] , and click on “Monitor Properties”

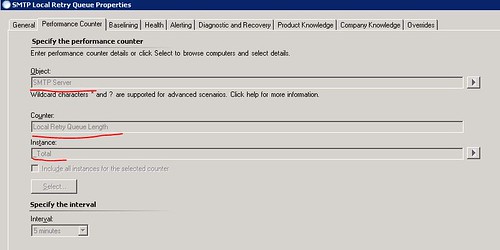
In “Performance Counter” tab, it is showing that this monitor is based on “Perfmon” and it is monitoring using the “Local Retry Queue Length” on “SMTP Server” Object of the Exchange Server.


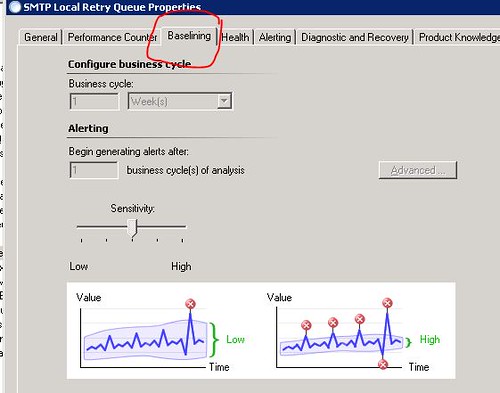
The Next tab in “Baselining”, which indicates that this is a “STT” Self Tuning Threshold Monitor. OK,,


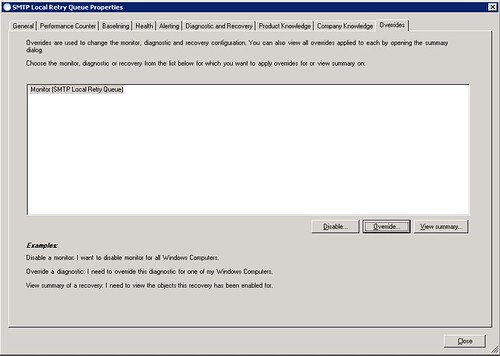
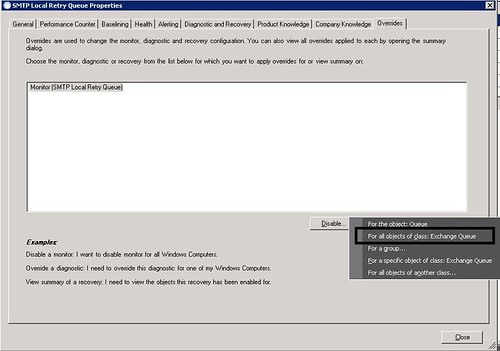
Now click on “Overrides” tab, and click on “Overrides”

Choose “ For All Object of Class Exchange Queue”


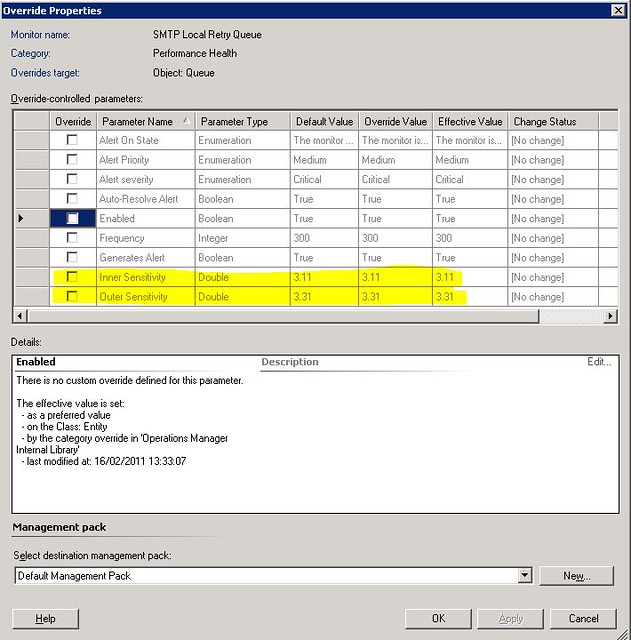
in Overrides the “Inner Sensitivity” of the monitor is 3.11 and I think it means if it have more then 3.X message in the Local retry queue it should send an alert.


how to check????
why not we manually check the “Local Retry Queue” performance counter manually, Isn’t it is a good idea?
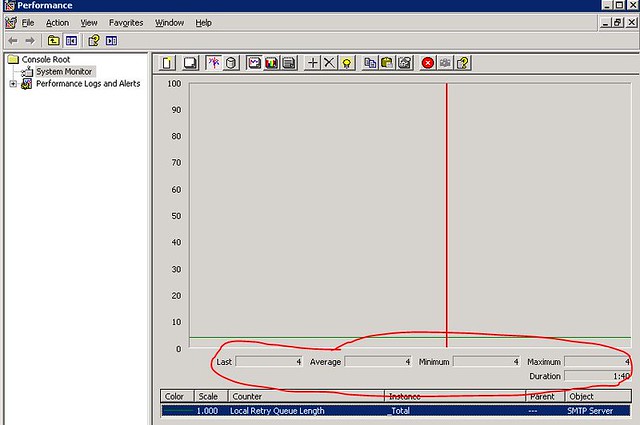
let’s do it, Open the “Performance Monitor” in Object choose “SMTP Servers” and in Counter choose “Local Retry Queue Length”
in Counter Explanation is says “ The Number of messages in the local retry queue”


Ok, so how many local messages are stuck, let check, OK , we have 4 local message stuck in the retry queue.


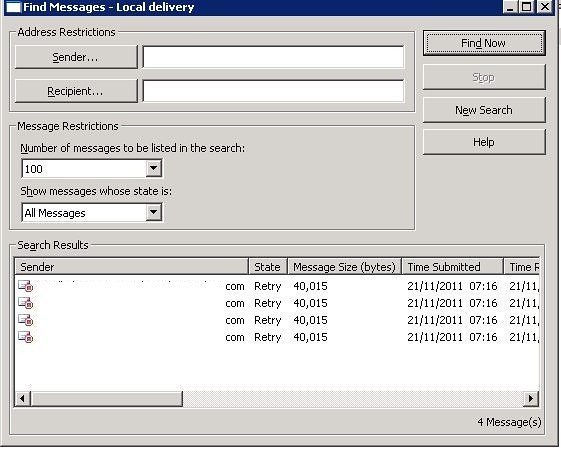
now go to your Exchange Server Queue and you will find that there is 4 messages are stuck.


let’s find them , Delete them if they are not necessary emails.


Once the Messages are deleted, our local retry queue is back to normal i means on Zero 0.


after 5-10 minutes the error should be gone otherwise you can choose the monitor and click on “Recalculate health” Option.


YippY!!! Exchange Server is Happy Again.


Thanks
Aman Dhally

Friday, November 18, 2011

Get-Overrides created on Specific Day .

hi,

yesterday one of our  SCOM admin created few overrides in SCOM and today he is on leave and the also not picking up the phone and I need to know which overrides he created.

Then i think that lets try to write a little basic PowerShell script which show the list of overrides created between specific number of days.

you can download the script from here : http://dl.dropbox.com/u/17858935/Get_SCOM_Overrides_by_Day_Created.zip

Make sure you run this script in “Operations manager Shell”

   1: ### I set $olddate to 2 Days ago date
   2:  
   3: $olddate = (Get-Date).AddDays(-2)
   4:  
   5: ## Select every Management pack and Piped it to "Get-Override)
   6:  
   7: $Mp = Get-Managementpack | Get-Override 
   8:  
   9: ### Now it will show only overrides which are created after $oldDate
  10:  
  11: $Mp| Where-Object { $_.TimeAdded -gt $olddate} | select ManagementGroupId,Name,TimeAdded | fl *
  12:  
  13: ######## E N D of S C R I P T #############

in $olddate i minus 2 days so if today is 18 November then $olddate should have 16 November stored in variable


OldDate


in variable $Mp in am storing all Management packs and piped them to Get-Overrides


MpPack


lets run $Mp lets see what we will get.


It shows the list of all Overrides in all management packs. Now we need to sort them.


MP2


$Mp| Where-Object { $_.TimeAdded -gt $olddate} | select ManagementGroupId,Name,TimeAdded | fl *


in above command , we piping $MP to where-Object cmdlet and choosing TimeAdded property in Overrides and comparing them with our variable $OldDate , so if the TimeAdded is property is greater then 16 November then it show all the Overrides created between 17,18 November.


seems working … :)


result


Download Link: http://dl.dropbox.com/u/17858935/Get_SCOM_Overrides_by_Day_Created.zip


Hope someone like it :)


Thanks


Aman Dhally

Monday, October 24, 2011

Agent Proxy on SCOM Agents


Hi,
When we install SCOM agents on any server or workstation after installation we need to enable [tick on] Agent Proxy on Agents properties via go to :
  • Administration Pane
  • Go to "Agent Managed" beneath "Device Management"
  • Search for the Agent
  • Right click on the Agent and select Properties
  • and tick on "Agent Proxy"


good Enough !!! but if we  installed SCOM Agent on 100 servers or if your organization have more then two administrators and rather then you other administrator installed the SCOM Agents and he forget to enable the “Agent Proxy” , then you you found that which Agents are “Proxy Enabled” and which are not.

There are two ways to accomplish it.

Option 1:
Check the Settings of each and Every SCOM Agent
Option 2
Use PowerShell :)
let me show you how .

Open “Operations Manager Shell

and type this command “Get-agent | ? { $_.ProxyingEnabled -match $False} ” and hit enter .
and this will show you the list of All agents which doesn’t have “Agent Proxy” enabled.

to be more precise we can also select name of the Agents
Get-agent | ? { $_.ProxyingEnabled -match $False}  | select Name

That’s all :)

now we know on which “Agent” we need to enable “agent Proxy” setting.


Thanks
Aman Dhally

Monday, July 11, 2011

SCOM: Use Operations Manager Shell to close multiple Alerts generated by Same Rule

Hi,

When today i login in to my SCOM console I saw approx 134 Active Alerts about Microsoft SQL Job failure. I was about to close these alert but then one thing strike in my mind that lets try to close these alerts using “Operations Manager Shell”. These Alerts are generating from same source and the name of the alert is same to it would not be to hard. So let try.

problem

Our First Step is to find out the Command which can show us Alert in SCOM Shell.

Open “Operations manager shell” and type  Get-Command *alert* , this will search for all SCOM cmdlets which have the word alert (we use wildcard *), and as you know PowerShell cmdlets works on Verb-Noun format  so if we use Get-Alert cmdlets it will shows all alerts.

alert

Let Try Get-Alert

alert-2

Type get-alert in the shell and hit Enter and it shown you all alerts.

Sol-5

Next task is to choose which Alert to Close .. if you look at active Alert in SCOM CONSOLE name of My Alert is “"A SQL job failed to complete successfully"

 problem-1

Now our next step is to find the properties and methods supported by Get-Alert command. To know these we need to use another command Get-Member

member

Yes.. it has name property…Gr8

Sol-2

Now we need to see all alerts whose name match “"A SQL job failed to complete successfully", for filter the output from Get-alert command we pipe (|) the output of Get-Alert command to Where-Object cmdlet.

Get-alert | Where-Object { $_.Name -match "A SQL job failed to complete successfully"}

where 

This will show all alerts whose name matches with "A SQL job failed to complete successfully"

So now our next step is to find a cmdlet which can close these alerts. lets find out..  run the same command

Get-Command *alert*

resolve-alert

So this time we have find Resolve-Alert cmdlet. now we need to join and our cmdlets command using piping . so this should be like this.

get-alert | where-object { $_.Name -match "A SQL job failed to complete successfully"} | Resolve-alert

rr

in Get Alert we are searching for an Alerts | then we are filter then using Name with match to “Sql job Failure | and then we are resolving them.  now type the above command and hit enter. It will take sometime to do this.

When you command run successfully, open SCOM Console and search for same SQL JOB error and you will found nothing :)

Solved-7


I hope that it helps someone…

Thanks

Aman Dhally

Friday, July 8, 2011

Mystery of Blank Schedule Email Reports in SCOM

Hi,

After deployment of Reporting Server for SCOM we test the working of Reporting Server by generating few “Windows Generic Reports” manually and they works perfect. So we plan to schedule Reports for a weekly delivery on Emails. So that we can have the statistics of our server weekly.

So when we test schedule email reports in SCOM, but when reports arrives in an email they are with no data completely blank email with link to Reporting Server. Then we investigate on internet and found that this is a knows issue (KB:  http://support.microsoft.com/kb/972821) and we also found  the blog posting on Kevin Holman on the same Issue. (Please visit his blog posting  for more clarifications..click here )

So Lets try.

Step:1

Login to your SQL Reporting Server for SCOM

Navigate to default Reporting Server installation path and navigate to ”Reporting Services\ReportServer\bin”   and Open

ReportingServicesService.exe.config” in notepad.

C:\Program Files\Microsoft SQL Server\MSRS10.MSSQLSERVER\Reporting Services\ReportServer\bin”

2 


Step:2

After opening “ReportingServicesService.exe.config”  we need to insert below code in to this file. The main issue is where to insert the Code.


To resolve this problem, add the following information to the ReportingServicesService.exe.config file in the ReportServer\bin directory:

<dependentAssembly>
<assemblyIdentity name="Microsoft.ReportingServices.ProcessingCore" publicKeyToken="89845dcd8080cc91" culture="neutral" />
<bindingRedirect oldVersion="9.0.242.0" newVersion="10.0.0.0" />
</dependentAssembly>
<dependentAssembly xmlns="urn:schemas-microsoft-com:asm.v1">
<assemblyIdentity name="Microsoft.ReportingServices.ProcessingCore" publicKeyToken="89845dcd8080cc91" culture="neutral" />
<bindingRedirect oldVersion="9.0.242.0" newVersion="10.0.0.0" />
</dependentAssembly>

The Right Position of Correct code is below.


This XML section must be added in between <runtime><assemblyBinding…> and </assemblyBinding></runtime> statements of the \ReportServer\bin\ReportingServicesService.exe.config file.


3


After Insert the Code in to “ReportingServicesService.exe.config” . save the file and reboot the “SQL Server Reporting Service”


4


That’s all :) ..


BUT…


But i after doing that problem is still not resolved. We still getting Black Reports. Now No Clue what to do next.  Then i tried the Following. I open the File in “Notepad++” and formatted it, save the file and restart SQL Reporting Server.


Before Formatting


Old-


After Formatting


Resolver


BingO.. this works for me … ( I know it doesn’t make any sense but it works) .. After done this my all schedule email reports works perfectly.


I hope that it may save some one else time ..


Thanks


Aman Dhally